Dashboard
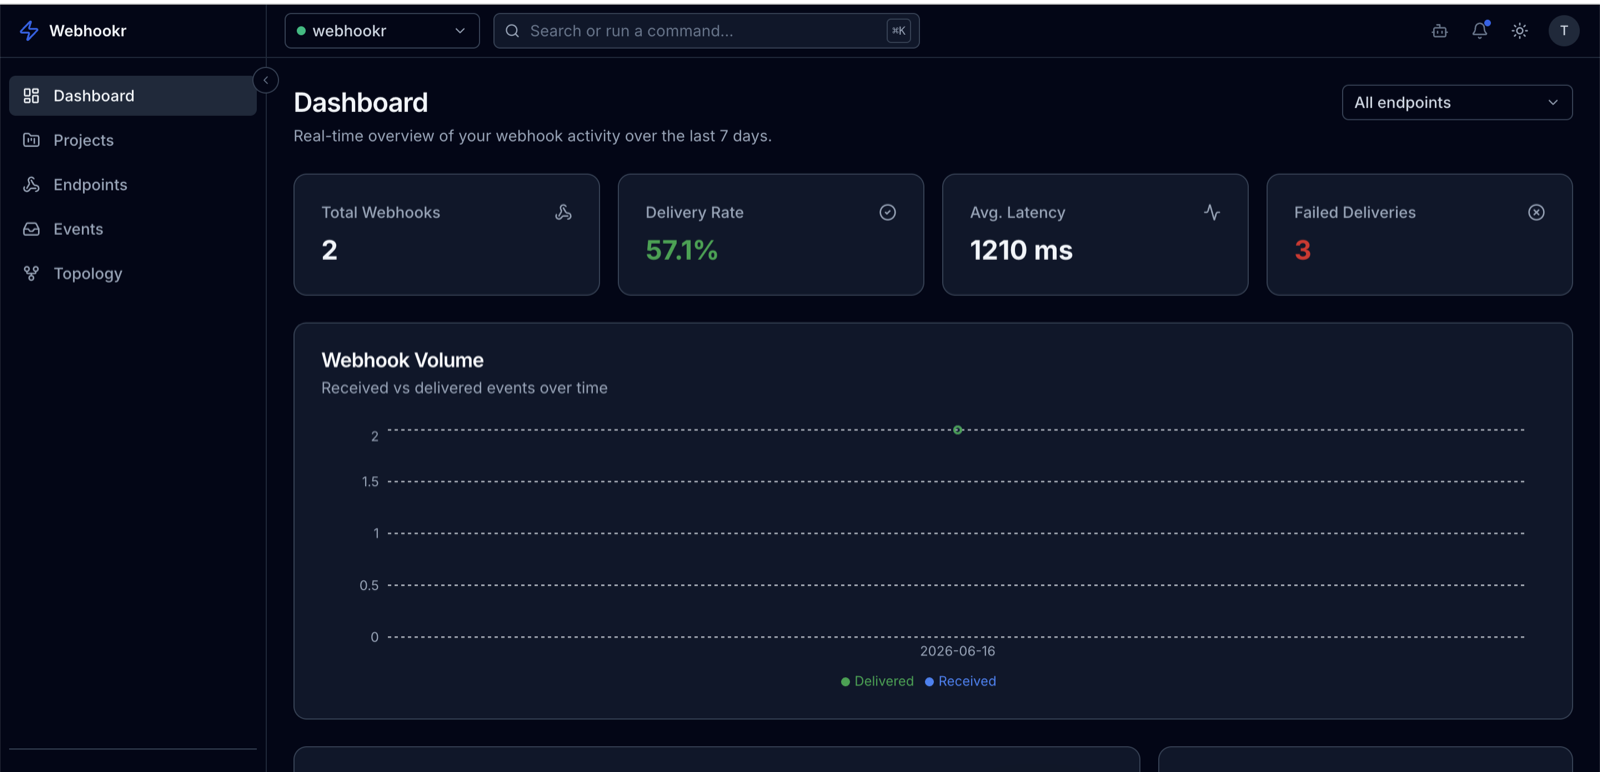
The dashboard (/dashboard) is the landing screen for the selected project. It summarizes recent webhook activity so you can see at a glance whether events are flowing and being delivered.
What it shows
- Activity over the last 7 days for the selected project — incoming events and their delivery outcomes.
- Stat cards and charts summarizing volume and success/failure rates.
The same activity view is reused on each endpoint's detail page, scoped to that single endpoint — so the numbers stay consistent between the project dashboard and an individual endpoint.
Per-endpoint activity
To see activity for one endpoint, open it from Endpoints (/dashboard/endpoints/<id>). The endpoint detail page shows the same metrics filtered to that endpoint, plus its Active / Inactive status and a link to edit it.
See Endpoints for managing endpoints, and Topology for a graph view of the same flow.