Topology
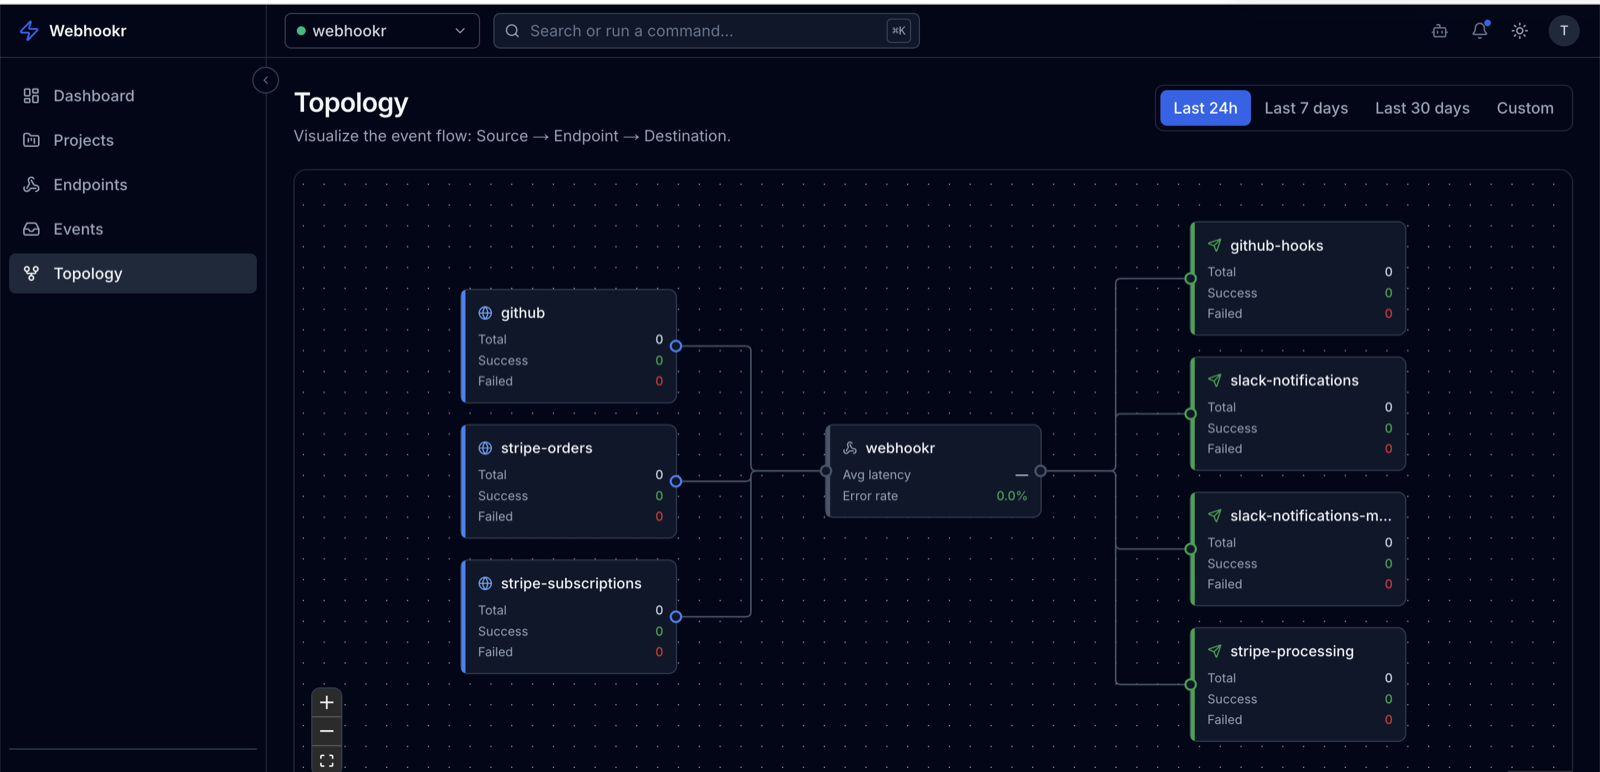
The topology view (/dashboard/topology) visualizes how events flow through a project as a graph:
Source ──▶ Endpoint ──▶ Destination
It answers, at a glance: where are events coming from, are they being processed, and are they reaching their destinations — with success, failure, and latency metrics on each node.
Reading the graph
The graph is laid out left to right in three columns.
Nodes
| Node | Represents | Metrics shown |
|---|---|---|
| Source (left) | An origin of events for the project — an endpoint receiving incoming webhooks. | Total events, successful events, failed events. |
| Endpoint (center) | The project's processing hub that routes events from sources to destinations. | Average latency (ms) and error rate. |
| Destination (right) | A delivery target configured on the project. | Total deliveries, successful deliveries, failed deliveries. |
A node is highlighted when it has activity in the selected period; nodes with no events in the period are visually de-emphasized.
Edges
- An edge from a Source to the Endpoint shows that events from that source are flowing into processing.
- An edge from the Endpoint to a Destination shows that processed events are being delivered there.
Together the edges trace the full path an event takes: from where it was received, through processing, to where it was delivered.
Interpreting the metrics
- Source — total / success / failed events: how many events arrived from that source and how they resolved. A high failed count points to delivery problems downstream.
- Endpoint — average latency: typical processing-to-delivery time in milliseconds. Rising latency signals slow destinations.
- Endpoint — error rate: the share of events that failed to deliver successfully. A non-zero rate is your first signal to investigate destinations.
- Destination — total / success / failed deliveries: delivery volume and outcomes for that target. Concentrated failures on one destination isolate the problem to that target.
Time period
The graph is scoped to a time period, selected with the period filter:
- Last 24 hours (default)
- Last 7 days
- Last 30 days
- Custom range (a start and end date)
The selected period is reflected in the page URL (for example ?period=last_7d) so a view can be shared or bookmarked.
Clicking a node
- Click a Source — opens a drawer listing that source's recent events in the period, each with its status (
success/failed), timestamp, target destination, and any error message. - Click a Destination — opens a drawer listing that destination's recent deliveries in the period, each with its status, timestamp, originating source, and any error message.
- The Endpoint node is informational and summarizes processing for the whole project; it shows the project-wide latency and error rate.
A screenshot of the source events drawer (opened by clicking a Source node) will be added here.
Event-level topology
The current topology is project-level: it aggregates sources, the processing hub, and destinations for the selected period. Per-event flow is available by drilling into a node's drawer and then opening the individual event or delivery.
Next
- See the Topology concept for the underlying model.
- Investigate failures via Events and Troubleshooting.